Science, multi-target tracking, radar simulation
Radar Track Lab
- Public ADS-B truth
- 20 Monte Carlo runs per condition
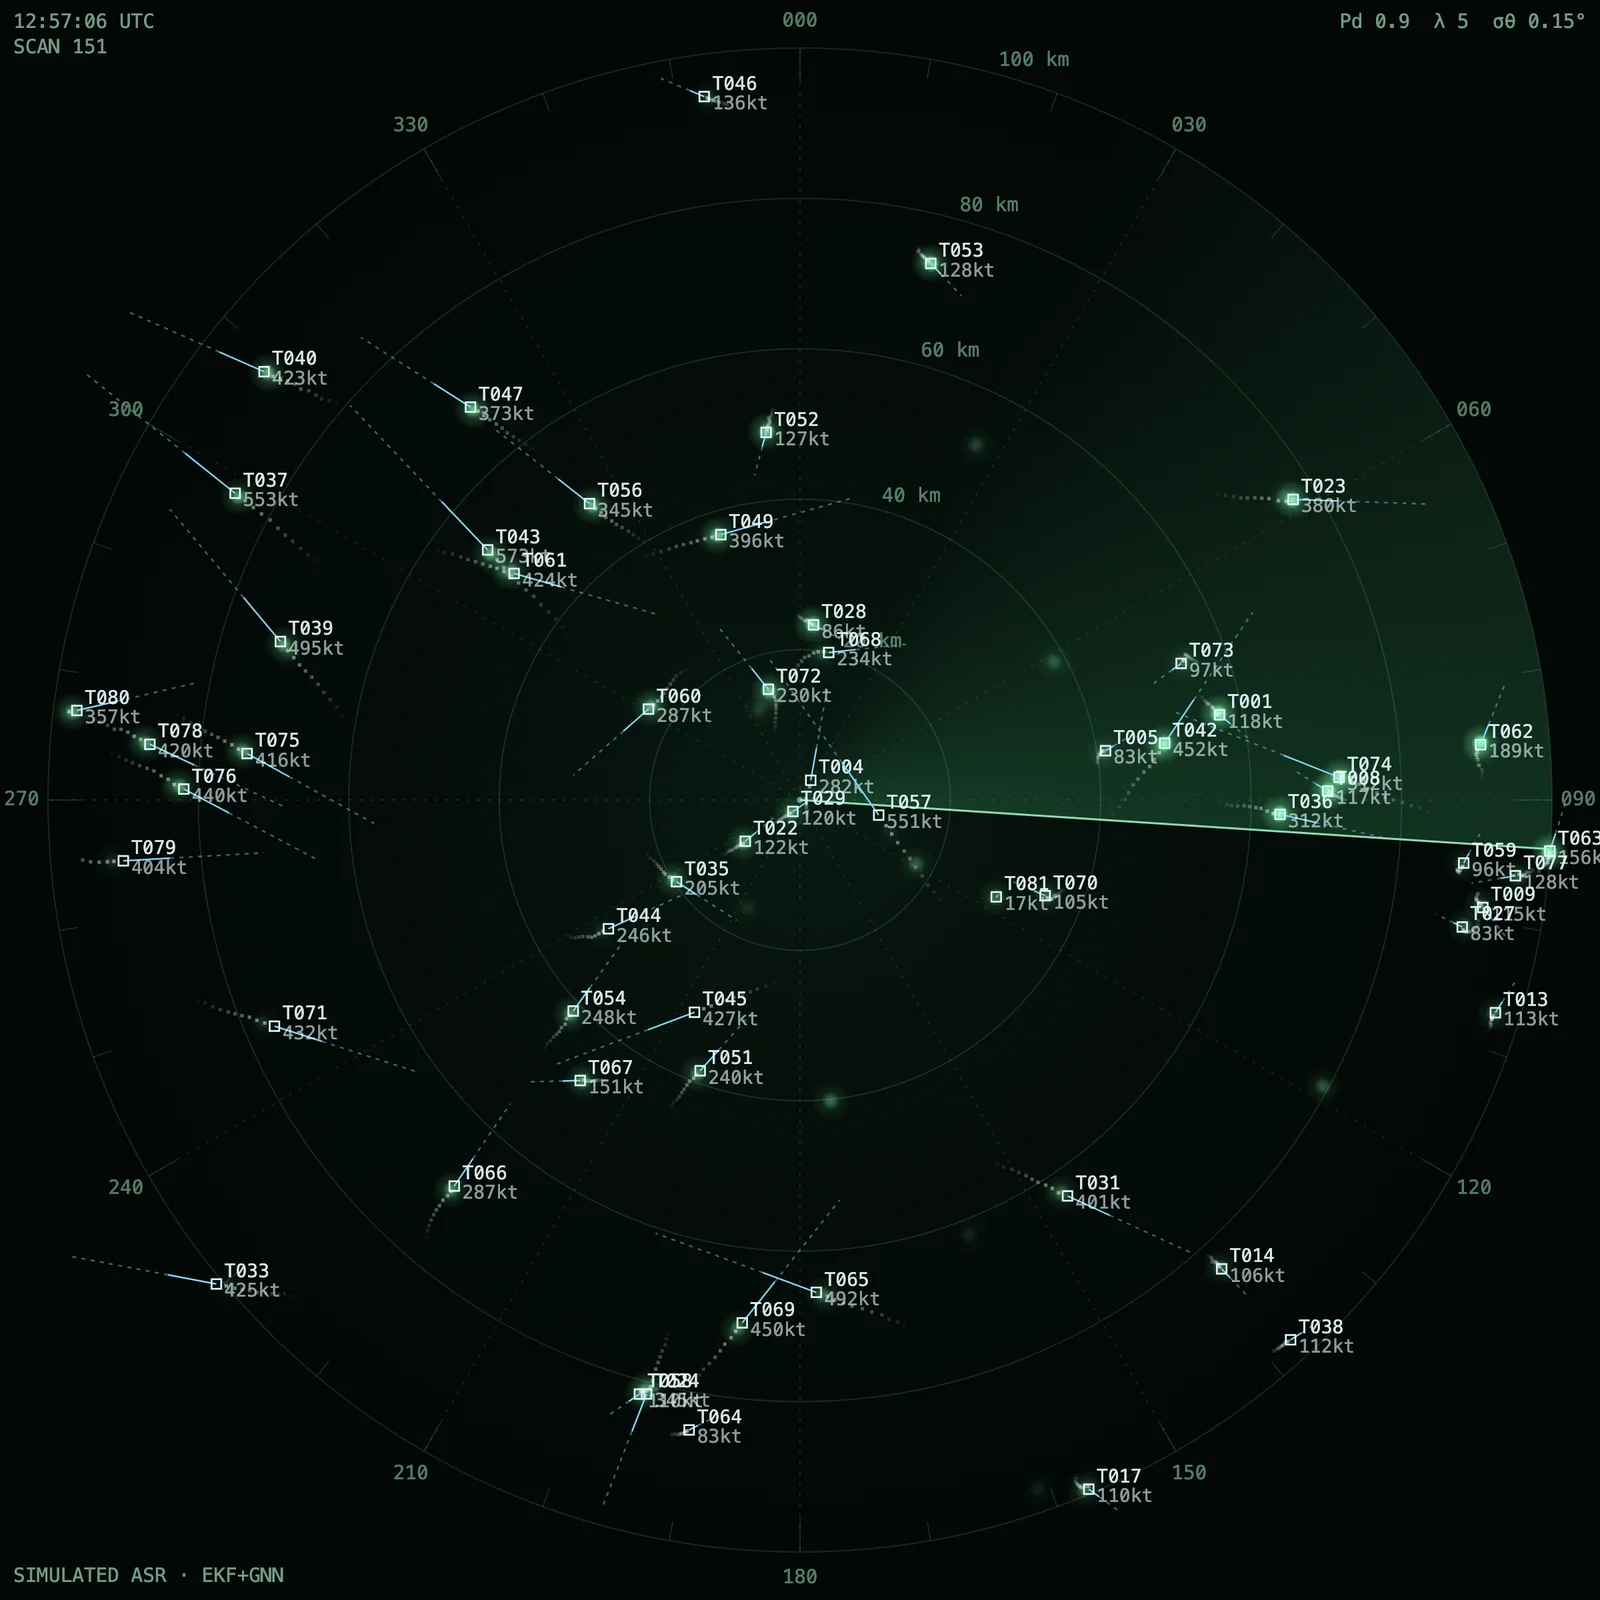
A multi-target tracker for a simulated airport surveillance radar, evaluated against real aircraft trajectories. Public ADS-B records of a busy half hour near Amsterdam Schiphol are the ground truth; a virtual rotating radar turns them into noisy detections with misses and clutter, and an extended Kalman filter with Hungarian assignment is compared with a nearest-neighbour baseline that receives exactly the same detections.
Code on GitHub: hyh4867/radar-track-lab ↗
The question
How much does a filter-and-assignment tracker improve on simply joining each detection to the nearest earlier one when the targets are real aircraft in busy terminal traffic, and where does it still go wrong?
Setup
Sensor: a virtual 2-D rotating airport surveillance radar at the Schiphol reference point, covering 100 km, with textbook values: one rotation every 4.8 s (12.5 rpm), range noise σr 50 m, bearing noise σθ 0.15°, detection probability Pd 0.9, and 5 clutter detections per scan on average. These are generic values at the level of public textbooks, not the specifications of any real military system.
Ground truth: adsb.lol ADS-B records for 6 November 2026, 12:45–13:15 UTC (30 minutes, 375 scans), the busiest part of that day. After keeping only airborne ADS-B positions with a position-accuracy category (NACp) of 8 or better, 149 aircraft appear in the window, about 50 per scan (50.4 on average, at most 58).
Each detection is timed when the beam passes the target's bearing, and the true position at that instant is interpolated from the neighbouring ADS-B points. A leave-one-out test puts that interpolation error at about 6–7 m RMS, an order of magnitude below the radar noise.
Aircraft flagged as military, LADD or PIA are dropped at the first step, and no registration, flight number or ICAO address is kept; aircraft get plain numbers. There is no threat evaluation or classification of any kind.
What I built
The tracker is an extended Kalman filter with a nearly-constant-velocity model and polar (range, bearing) measurements. Each track–detection pair is predicted to that detection's own time, gated with a χ² test, and assigned with the Hungarian algorithm (global nearest neighbour). Tracks are confirmed after 3 detections in their first 4 scans and deleted after 5 missed scans.
The process-noise level (q = 25 m²/s³) was chosen from ten candidates on a separate 15-minute tuning window (10:00–10:15 UTC) only, never on the evaluation window.
The baseline has no filter: a track's position is its last detection, and it is joined greedily to the nearest detection within 2 km. Track management is the same as the tracker's, so the differences come from filtering, prediction and gating alone.
Tracker against baseline
| Measure | EKF + Hungarian tracker | Nearest-neighbour baseline |
|---|---|---|
| Position RMSE at evaluation time | 174.7 ± 1.2 m | 528.1 ± 1.4 m |
| Position RMSE right after an update | 125.8 ± 0.5 m | 172.8 ± 0.6 m |
| ID switches (30 min) | 24.9 ± 2.1 | 459.2 ± 7.8 |
| Track breaks (30 min) | 3.6 ± 0.7 | 414.2 ± 7.9 |
| Missed targets per scan | 0.82 ± 0.02 | 4.02 ± 0.07 |
| False tracks per scan | 1.08 ± 0.01 | 4.91 ± 0.07 |
| Track initiation delay, mean | 13.8 ± 0.2 s | 14.1 ± 0.3 s |
| Mean GOSPA (all-target summed metric) | 2,236 ± 10 m | 5,508 ± 24 m |
| GOSPA, localisation part | 1,229 ± 9 m | 3,592 ± 8 m |
| GOSPA, missed-target part | 1,282 ± 12 m | 2,833 ± 23 m |
| GOSPA, false-track part | 1,468 ± 7 m | 3,134 ± 21 m |
Dense clutter
| Clutter per scan, method | Position RMSE | ID switches (30 min) | False tracks per scan | Missed targets per scan |
|---|---|---|---|---|
| 5, tracker | 174.7 ± 1.2 m | 24.9 ± 2.1 | 1.08 ± 0.01 | 0.82 ± 0.02 |
| 5, baseline | 528.1 ± 1.4 m | 459.2 ± 7.8 | 4.91 ± 0.07 | 4.02 ± 0.07 |
| 200, tracker | 184.6 ± 1.8 m | 43.2 ± 3.0 | 12.23 ± 0.20 | 0.93 ± 0.02 |
| 200, baseline | 545.2 ± 1.3 m | 692.8 ± 10.3 | 62.36 ± 0.52 | 4.35 ± 0.07 |
| 1,000, tracker | 230.1 ± 2.9 m | 344.6 ± 17.0 | 555.22 ± 2.31 | 0.91 ± 0.03 |
| 1,000, baseline | 576.5 ± 1.6 m | 2,156.4 ± 15.1 | 1,016.35 ± 2.11 | 3.43 ± 0.04 |
Filter consistency (NEES)
| Case | Samples | ANEES | 95% interval for that many samples | Update steps inside their 95% interval |
|---|---|---|---|---|
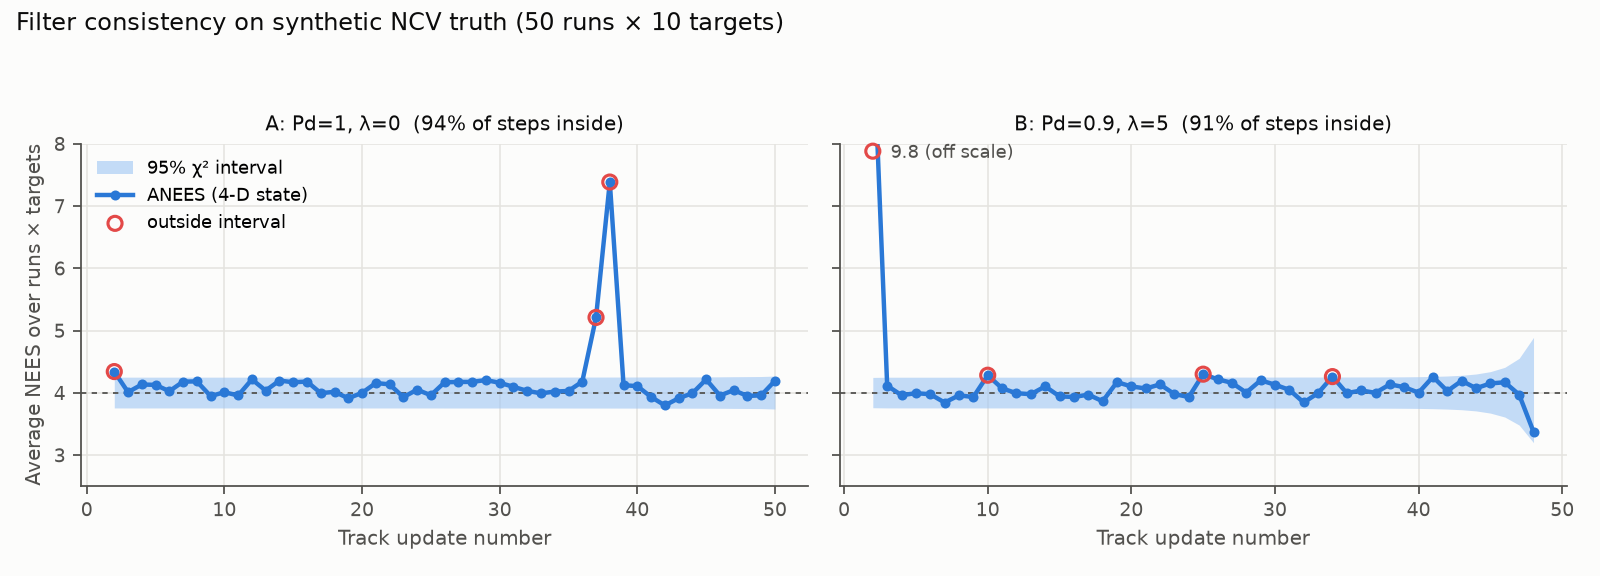
| A: Pd 1, no clutter | 24,269 | 4.16 | [3.96, 4.04] | 93.9% (46 / 49) |
| B: Pd 0.9, 5 clutter per scan | 21,722 | 4.19 | [3.96, 4.04] | 91.5% |
Evaluation
Each scan is scored when it ends: confirmed tracks are predicted to that instant (the baseline keeps its last detection) and compared with the ADS-B truth at the same instant. The first 60 s are left out.
Position RMSE is taken over track–aircraft pairs closer than 2 km. The after-update RMSE uses tracks right after a detection updates them, which removes the prediction gap between scans. An ID switch is a change of track number on the same aircraft; a track break is a lost pairing while the aircraft is still in the truth.
Each condition runs 20 times with fixed seeds: the truth stays the same while noise, misses and clutter change, and the tracker and the baseline receive the same detections. ± is the 95% t-interval of the mean.
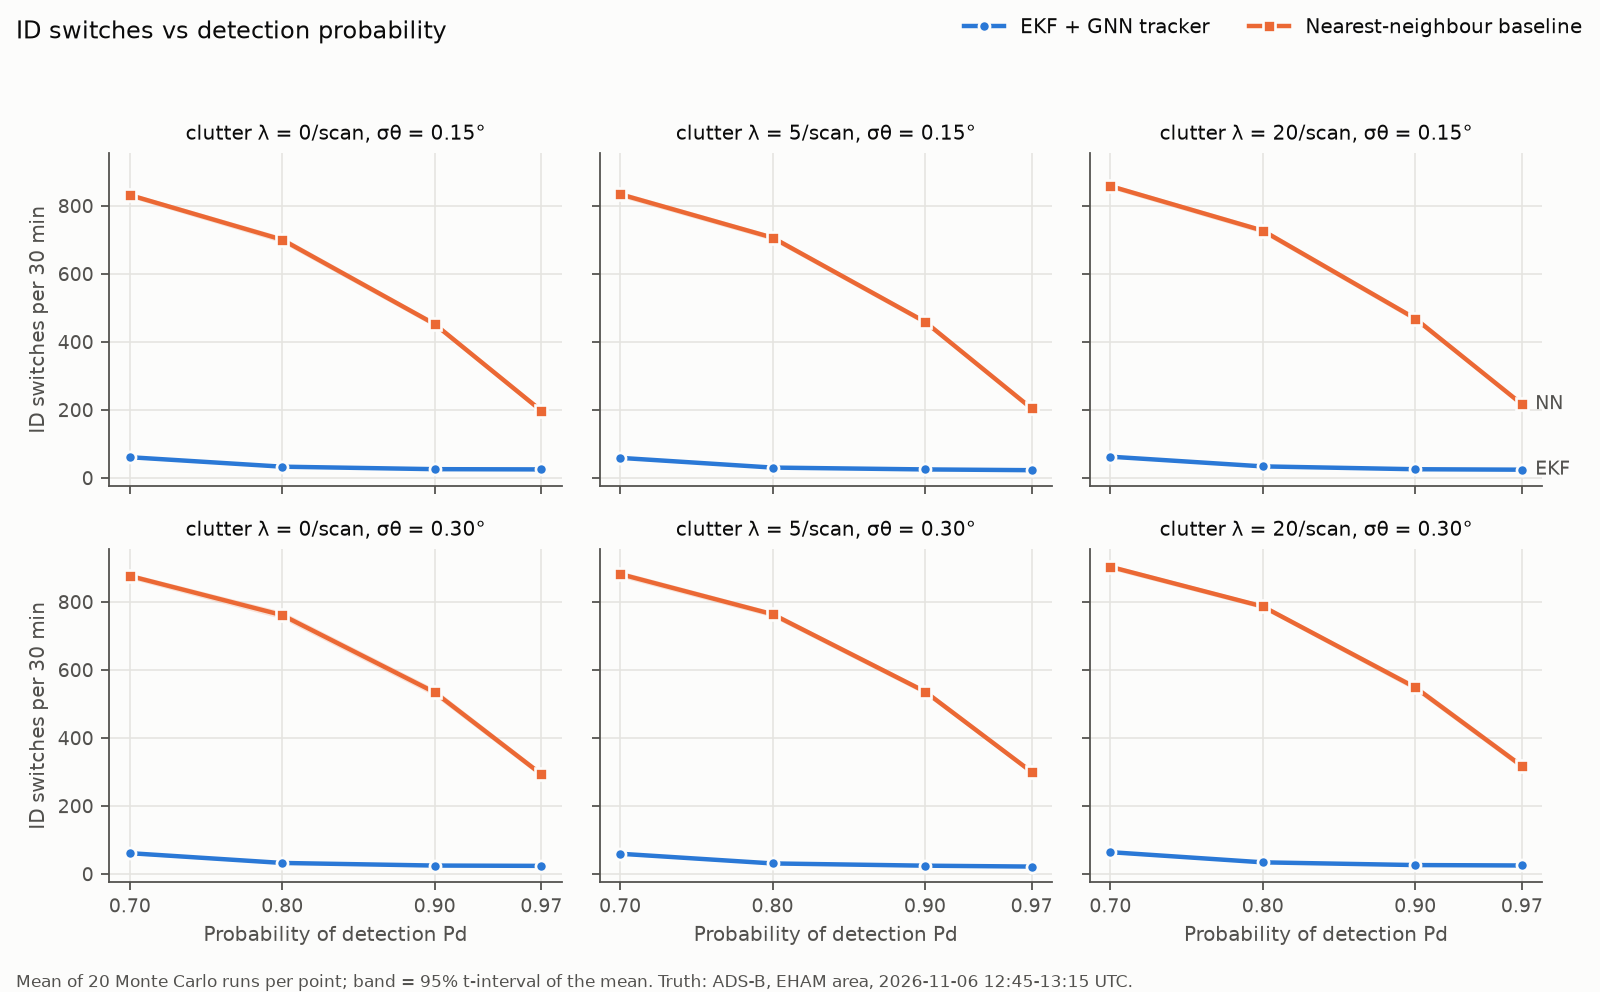
Noise sweep: detection probability 0.7, 0.8, 0.9 and 0.97 × clutter 0, 5 and 20 per scan × bearing noise 0.15° and 0.30°, so 24 conditions, 20 runs each, for both methods. An extra run raised clutter to 200 and 1,000 per scan at Pd 0.9 and σθ 0.15°.
Filter consistency is checked with NEES on synthetic truth that follows the model exactly. Real trajectories do not follow a constant-velocity model, so NEES on the ADS-B truth is reported but not used as a consistency test.
Key findings
On the same detections, the tracker cut position RMSE from 528 m to 175 m and ID switches from 459 to about 25 in 30 minutes; track breaks fell from 414 to 3.6.
Most of the baseline's 528 m comes from standing still at its last detection between scans. Right after an update the gap is smaller: 173 m against 126 m, 27% lower.
In the noise sweep the tracker's ID switches stayed at 22–26 per 30 minutes for Pd 0.9 and above, rose to 30–34 at Pd 0.8 and 59–64 at Pd 0.7. The baseline made 197–903 across the same conditions.
With sparse clutter (up to 200 false alarms per scan, 6.4×10⁻³ per km²) the tracker holds: position RMSE rises by only 10 m. At 1,000 per scan (3.2×10⁻² per km²) it breaks down, confirming 555 false tracks per scan, because clutter points fill the wide initiation gates.
With the model's own motion, the average NEES was 4.16 (Pd 1) and 4.19 (Pd 0.9 with clutter), slightly above the 95% interval [3.96, 4.04]; 46 of 49 update steps were inside their own interval. The largest values came from two samples 1.0 and 1.4 km from the radar, where the linearised polar measurement breaks down; beyond 5 km the average was 4.07.
On the real ADS-B truth the average NEES was 2.85 (median 2.00): the filter is more cautious than it needs to be on straight legs, because q was tuned to keep up with turns.
Where the errors come from
Of the tracker's 24.9 ID switches per run, 7.0 followed an ADS-B gap longer than 20 s, when the aircraft disappears from both the truth and the simulation; 4.6 happened with another aircraft within 3 km, where crossing traffic at different altitudes looks merged in 2-D; and 13.3 were tracks lost while the aircraft stayed present. That last group is probably the constant-velocity model falling behind in turns, but I did not check the cases one by one.
Of 1.08 false tracks per scan, 1.00 were tracks coasting for up to 5 scans after their aircraft left the truth (landed, left coverage or an ADS-B gap). No track was confirmed from clutter in this condition.
Of 0.82 missed targets per scan, 0.75 were aircraft that had just appeared and were not yet confirmed by the 3-of-4 rule, which takes about 3 scans (14 s). Only 0.08 had been tracked before and were lost.
My role and the agent workflow
I set the scope and the rules: a civil airport radar only, public data only, no threat evaluation, a baseline that receives the same detections, tuning on a separate window, and every number taken from the result files.
AI agents implemented the simulator, tracker, evaluation and demo in bounded steps on my instructions. I reviewed their output and keep responsibility for the claims on this page.
Limits
Flat 2-D geometry: altitude and slant range are ignored, so aircraft at different altitudes that cross in the plane cannot be told apart, and there is no overhead blind cone, vertical coverage or low-altitude shadowing from the Earth's curvature.
The truth contains only aircraft that broadcast ADS-B. 54 aircraft seen only by multilateration in this window, probably small aircraft, are left out of the simulation, as are aircraft on the ground.
ADS-B interpolation error (about 6–7 m RMS) and the ADS-B position error itself remain in the truth. Gaps longer than 20 s make aircraft vanish and reappear, which causes some of the ID switches and false tracks.
The radar values are generic textbook and standards-level values, not any particular equipment: constant Pd, uniformly spread clutter, Gaussian noise, no bias, no merging of close targets and no multipath.
A single constant-velocity model lags in turns. An interacting multiple model (IMM) was not tried.
Dense clutter defeats the track initiation: probabilistic association (JPDA/MHT) or clutter maps would be the next step; they were not tried here.
One 30-minute window at one airport. The process noise was tuned on another 15-minute window of the same day.
Evidence and reproducibility
Every number on this page comes from the project's results file (results/RESULTS.md), which a script generates from the run files; it also lists all 24 sweep conditions and the ground-truth filtering steps. The figures are produced by the project's plotting script from the same runs.
Data: adsb.lol globe_history_2026, records of 6 November 2026. Contains information from adsb.lol, made available under the ODbL 1.0; trajectory-derived files are under the ODbL 1.0 as well. The radar values cite the ASR-11 rotation rate and EUROCONTROL surveillance requirements as reported by ICAO.